Gluconeogenesis
Learning Objectives
Describe the tissues where gluconeogenesis occurs and the key enzymatic determinants of this specificity.
Explain the major precursors of gluconeogenesis, including where they are derived from and at what step they integrate.
Evaluate how the flow of each these precursors is regulated differently, dependent on where they enter the gluconeogenic pathway.
Analyse the energetic costs of gluconeogenesis, given the precursor substrate.
Describe how chronic activation of gluconeogenesis results in ketone body production from the liver.
Understand the importance of the Cori and Cahill cycles in recycling waste products back to glucose.
Recognize the key steps by which gluconeogenesis is controlled by allosteric control, protein phosphorylation and transcriptional changes, especially in response to insulin, glucagon/adrenaline and Cortisol.
Evaluate how the cell ensures that gluconeogenesis and glycolysis do not occur simultaneously.
Key Concepts and Vocabulary
Cori Cycle and Cahill Cycle
Glucocorticoids, including Cortisol
Gluconeogenic Substrates
Direct Regulation (in the liver) vs Indirect Regulation of Gluconeogenesis
Pyruvate Carboxylase and its regulation
PEPCK and G6Pase and their regulation
Alanine Aminotransferase (ALT)
The Importance in Maintaining Blood Glucose Levels
Glucose is not an essential macronutrient. Unlike vitamins, minerals, essential amino acids, and \(\omega\)-3/6 fatty acids we are able to make glucose even if there is no dietary source. This process is called gluconeogenesis. While many of the tissues that we focus on in this course can use a variety of substrates for fuel, some tissues are highly dependent on glucose. Among these are the brain, and red blood cells. Adding to this problem, neurons are very poor at storing glucose as glycogen, which means they need a constant supply of glucose from the blood to maintain their function. While the brain is generally only 2% of the mass of a human, it consumes around 20% of the glucose in the body (Erbsloh et al. 1958). Even individuals who consume extremely low carbohydrate diets are able to maintain their blood glucose near the normal rangeWhile individuals on ketogenic diets still use a lot of glucose for brain function, there is evidence that in those individuals the brains can adapt to use ketone bodies as an energy source as well. We will discuss this in the lectures on lipid oxidation later on in the semester. (Bueno et al. 2013). The ability to maintain blood glucose, with limited dietary carbohydrate ingestion is the primary role of gluconeogenesis. In healthy humans, when gluconeogenesis is active, we produce the carbohydrate equivalent of over 6 cups of cooked rice per dayCalculated from values in Rothman et al. (1991), and the USDA food database..
Gluconeogenesis Primarily Occurs in the Liver
The primary glucose producing tissues are the liver and the kidneys, though in terms of circulating glucose the liver predominates. The molecular determinant of this is the presence of the enzyme Glucose-6-Phosphatase which catalyzes the removal of phosphate from Glucose-6-Phosphate, allowing it to be exported from the cell. While gluconeogenic substrates can become converted to Glucose-6-Phosphate through similar pathways described below, the final phosphate removal and release of glucose only occurs in cells with this enzyme.
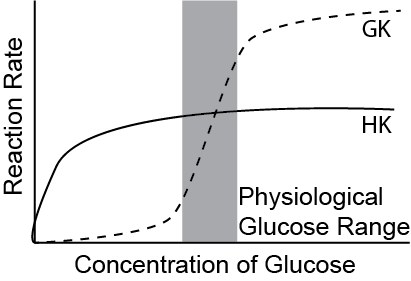
Glucokinase plays an important role in this process. If you recall from the lecture on glycolysis, the enzyme kinetics of the Glucokinase is an important site of regulation (see Figure ↑. Muscle and adipose tissues have hexokinase, which is very efficient at phosphorylating even low concentrations of Glucose. Glucokinase, which is present in the liver, has very low kinetic efficiency at low glucose concentrations. This means that when glucose levels are low in the blood, Glucokinase will be inactive and Glucose-6-Phosphate dephosphorylation will not be undone.
Gluconeogenic Substrates
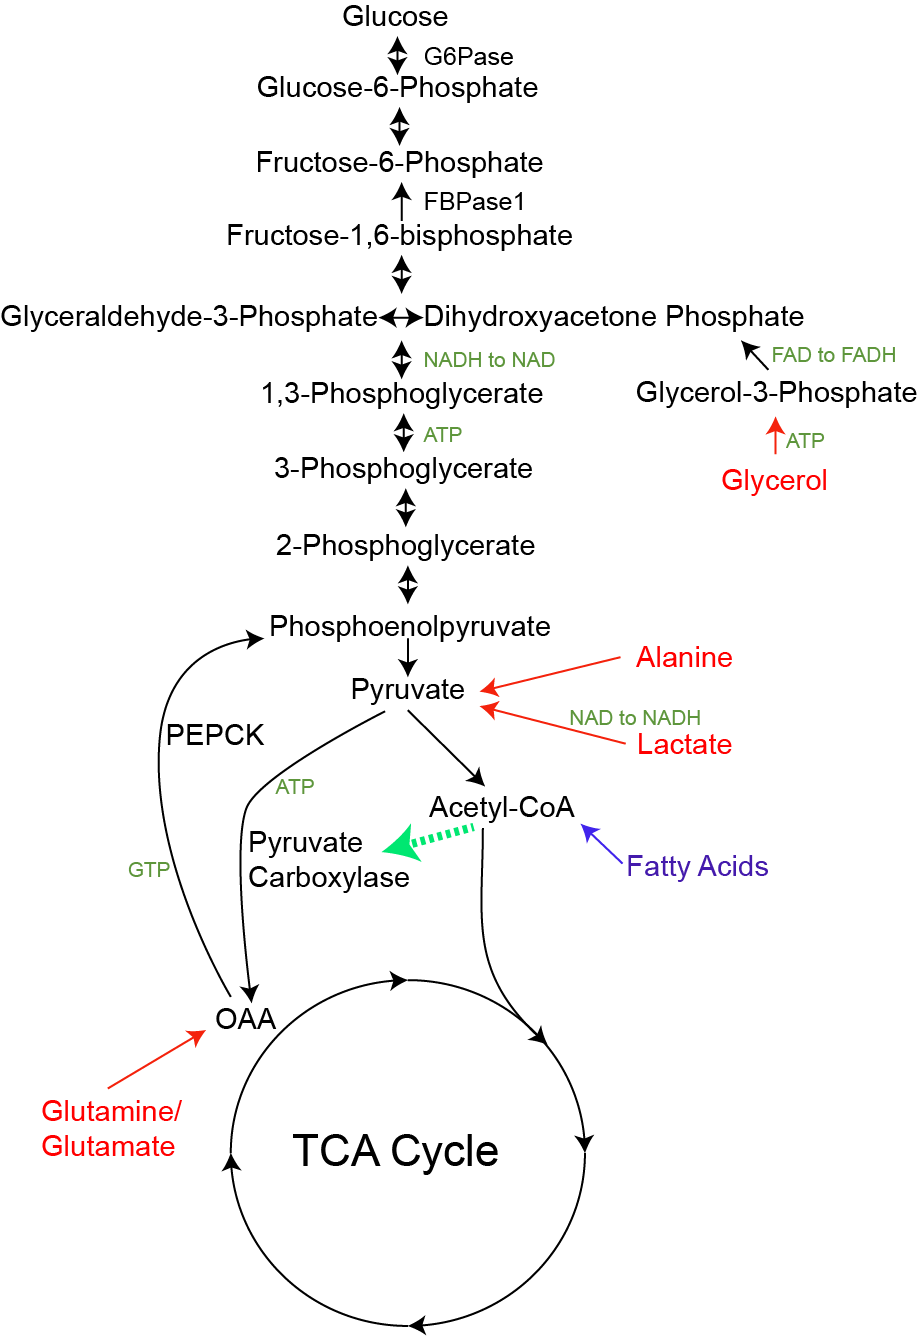
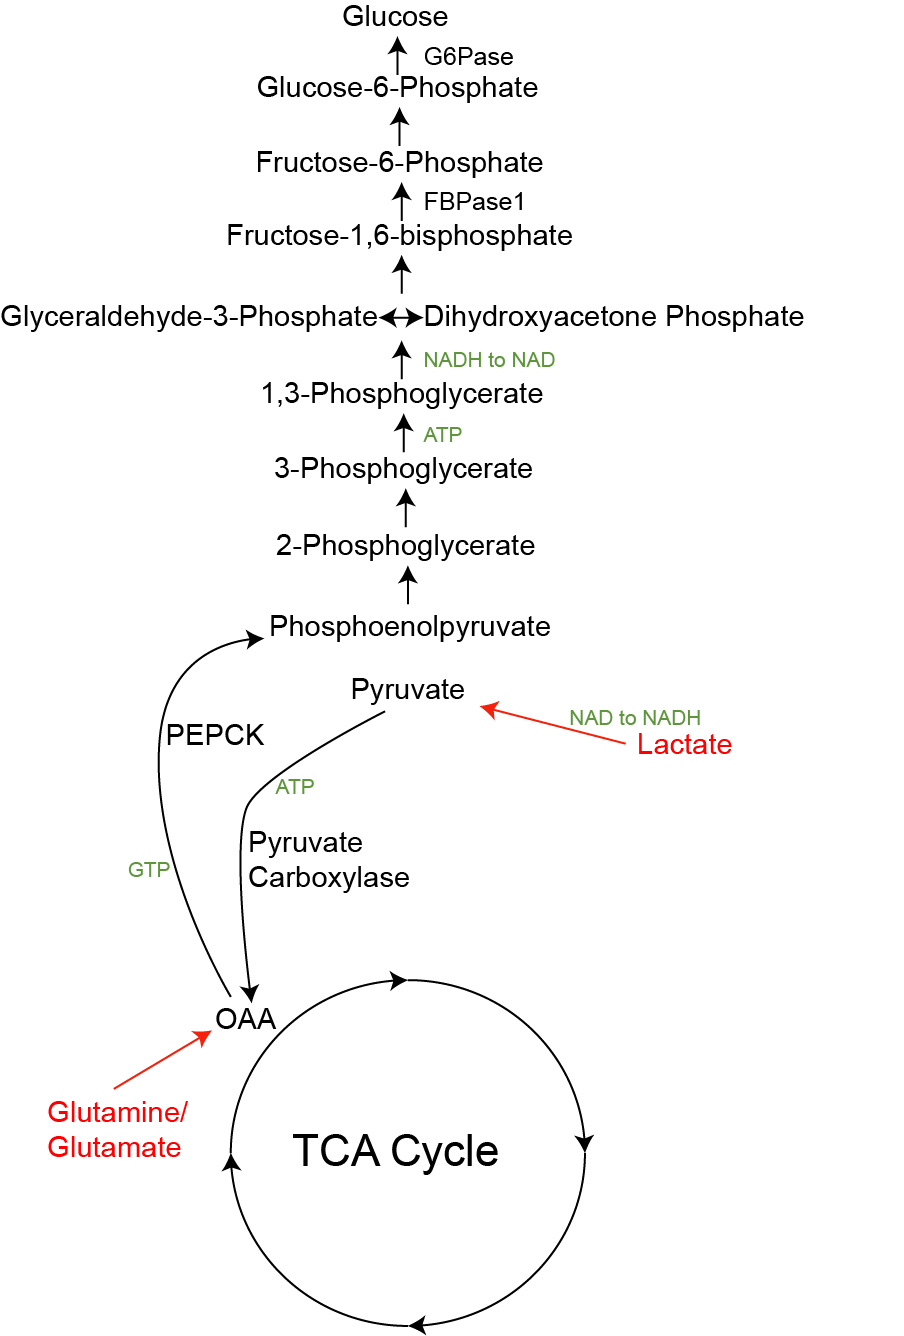
There are several substrates that can be converted into glucose as illustrated in Figure ↑. The main substrates are glycerol, lactate and alanine. The first thing to note is how similar the overlap of this pathway is to glycolysis. Most of the reactions in glycolysis are reversed in gluconeogenesis, and are catalyzed by the same enzymes, with only a few exceptions. One is that the Pyruvate Kinase step (from PEP to Pyruvate) is not reversible, and the other is that instead of PFK1, a different enzyme known as Fructose bisphosphatase (FBPase1) is used to generate Fructose-6-Phosphate. As you may have guessed, both of these are key sites of regulation. As you read about these reactions, consider that the biochemical steps where glycerol, lactate, or alanine enters the pathway, and see how that dictates what sites of regulation are important to the control its flow to glucose.
Glycerol
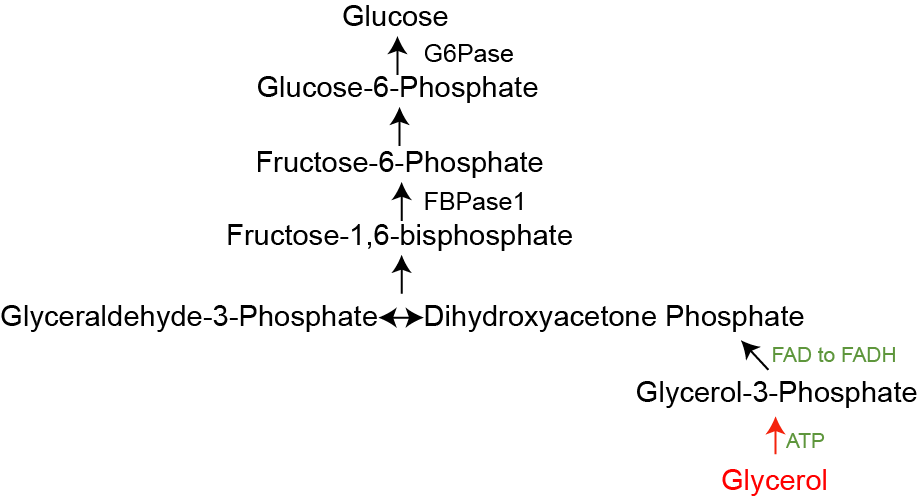
Glycerol is derived from the breakdown of triglycerides and is increased during lipolysis. That process releases both glycerol and free fatty acids, both of which traffic to the liver. While fatty acids (shown in blue in Figure ↑) are unable to be converted to glucose, they play a role in activating Pyruvate Carboxylase via Acetyl-CoA and providing energy to drive gluconeogenesis. Glycerol on the other hand becomes activated by phosphorylation, then is converted into DHAP. DHAP and GA3P are combined by Aldolase into Fructose-1,6-bisphosphate, which is then dephosphorylated by FBPase1. Figure ↑ shows how glycerol flows into glucose.
Lactate and the Cori Cycle
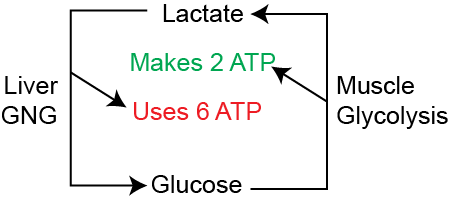
Lactate, the product of anaerobic glycolysis can be inter-converted back to pyruvate via the reversible actions of Lactate Dehydrogenase. This is an important inter-organ cycle called the Cori CycleOr the Lactic Acid Cycle. This is named after Carl and Gerty Cori who won the Nobel Prize in Medicine or Physiology for this and her work on glycogen metabolism. Gerty Cori was the first woman to win the Nobel Prize in Medicine or Physiology.. This cycle involves the anaerobic breakdown of glucose to lactate in the muscle, followed by its re-synthesis back to glucose in the liver. This re-formed glucose now travels back to the muscle (see Figure ↑). Overall this cycle consumes four ATP molecules, but is an important way to ensure that the muscle has sufficient glucose available for anaerobic metabolism. We discussed this previously, with respect to metabolic efficiency and the basal metabolic rate. If you go through a round of the Cori Cycle, you end up with exactly the same glucose molecule, but you have had to burn four ATP molecules. This is inefficient and would increase the basal metabolic rate. The route by which lactate becomes glucose is shown in Figure ↑.
Alanine and other Amino Acids
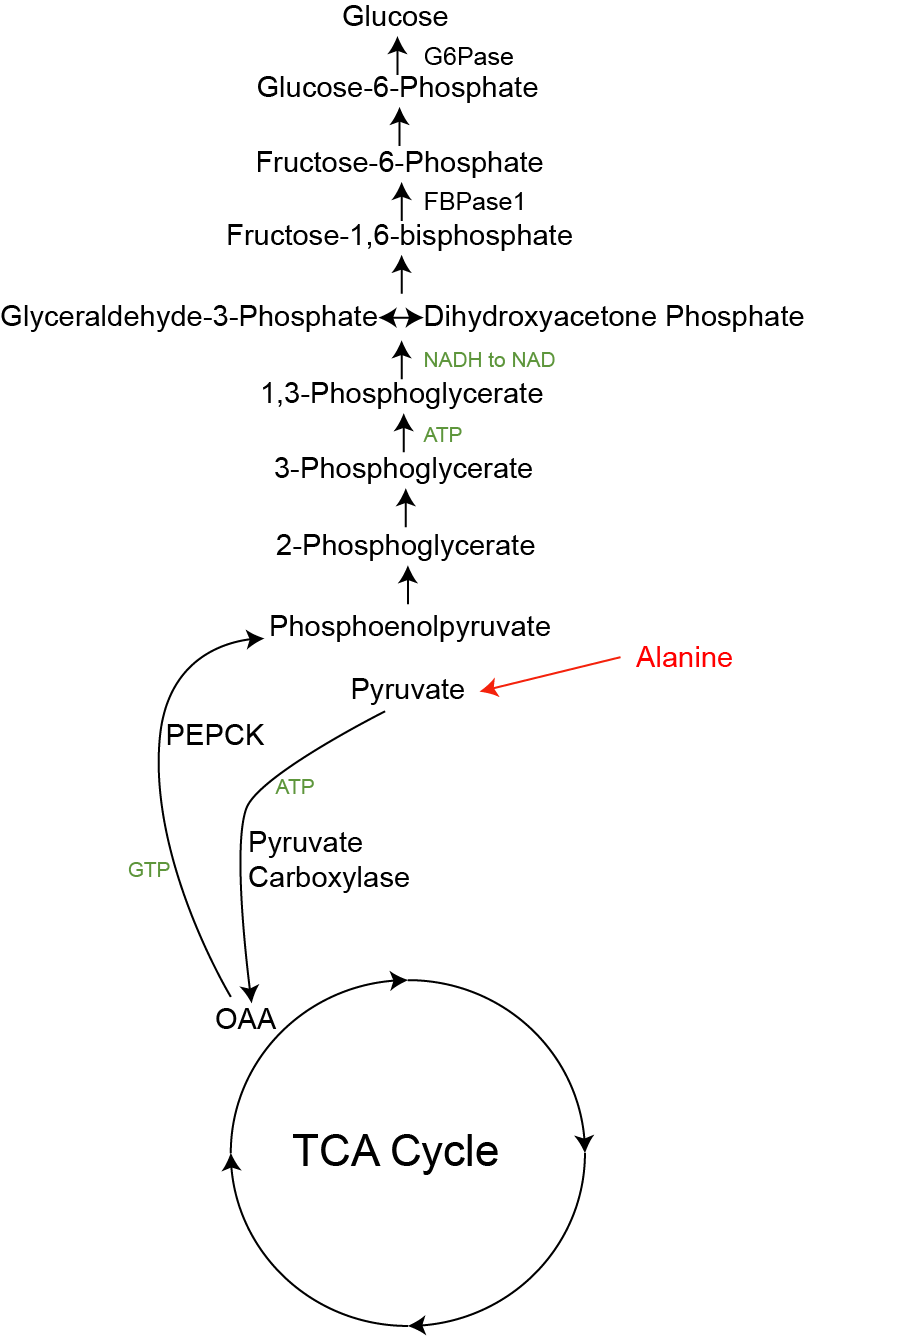
Several amino acids can be converted into glucose. This can be the case either when there is excessive dietary protein, or if proteins (primarily in the muscle) are broken down and sent to the liver. The class of amino acids that can become glucose is known as the glucogenic amino acids. The amino acids that cannot be converted to glucose are known as ketogenic amino acidsWe will cover this in more detail in the amino acid catabolism lectures.. The catabolic routes of the glucogenic amino acids vary but the most important of them is Alanine. As we discussed regarding the fates of Pyruvate, Alanine and Pyruvate can be inter-converted via the actions of Alanine Aminotransferase (ALT):
\[\begin{equation} \label{eq:alt} Alanine + \alpha - Ketoglutarate \rightleftharpoons Glutamate + Pyruvate \end{equation}\]
This enzyme is important for making Alanine (for example when levels are low and Pyruvate levels are high), but also can make pyruvate for gluconeogenesis when alanine levels are high and pyruvate levels are low. As shown in Figure ↑ the conversion of Pyruvate to PhosphoenolpyruvateThis is the inverse of the Pyruvate Kinase reaction that was important for glycolysis. is not a simple reversible reaction. Instead, for Pyruvate to undergo gluconeogenesis, it first must be carboxylated to oxaloacetic acid (OAA) by Pyruvate Carboxylase and then converted back to Phosphoenolpyruvate by the enzyme Phosphoenolpyruvate carboxykinase (PEPCK). Both of these enzymes are important sites of regulatory control. It is important to note that (absent the balancing influx of Alanine) activation of PEPCK is cataplerotic. It removes TCA cycle intermediates (OAA) and pushes them towards gluconeogenesis. This means that gluconeogenesis occurs at a cost of TCA cycle efficiency, since when OAA is depleted, Acetyl-CoA cannot enter the TCA cycle for energy production. This is the main reason why very low carbohydrate diets result in ketone body production. Gluconeogenesis depletes OAA, and Acetyl-CoA is converted into ketone bodies because it cannot enter the TCA cycle.
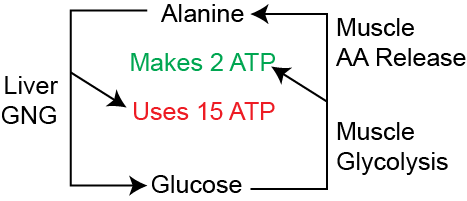
Alanine reconversion to glucose is known as the Cahill Cycle or Glucose-Alanine cycle. Similar to the Cori cycle, the cycle of Alanine release from muscle, conversion to glucose and then return to blood glucose is an important inter-organ metabolic loop. When muscle is broken down, Alanine is released and can be converted by the liver back into glucose for fuel. This is more costly than the Cori cycle, because Urea must be removed from Glutamate. This cycle uses 4 ATP equivalents for the Urea cycle and 11 ATP molecules for Gluconeogenesis, so requires a lot of energy from the liver. Unlike the Cori cycle, the Cahill cycle is not a closed circuit, as every round depletes amino acids from muscle, a result of muscle protein breakdown.
Energetic Demands of Gluconeogenesis
Gluconeogenesis is typically energetically costly. It requires a variable number of ATP molecules depending on the substrate. The energy consuming steps, are Pyruvate Carboxylase (one ATP), PEPCK, and Phosphoglycerate Kinase (1 ATP). Since at the Aldolase step, two three carbon precursors (GA3P and DHAP) are combined, this means that to make one molecule of glucose you need to follow this pathway twice. That means that to go from Pyruvate to Glucose you need 2 x 3 ATP equivalents plus two NADH equivalents (at the Glyceraldehyde Dehydrogenase step). Since each NADH is equivalent to 2.5 ATP molecules, gluconeogenesis from Pyruvate consumes 11 ATP equivalents per glucose produced. A summary for the main gluconeogenic substrates are shown in Table ↑.
| Substrate | Gluconeogenesis | Urea Cycle | Total |
|---|---|---|---|
| Glycerol | +1 | 0 | +1 |
| Lactate | -6 | 0 | -6 |
| Alanine | -11 | -4 | -15 |
Key Regulatory Steps in Gluconeogenesis
Since it is counterproductive to have gluconeogenesis and glycolysis operating simulataneously the regulation of these pathways is largely reciprocal. Generally when one pathway is activated, the other is inactivated. In the case of gluconeogenesis, the key points of regulation are Pyruvate Carboxylase, PEPCK, FBPase and Glucose-6-Phosphatase/Glucokinase. These are under a combination of acute (rapid and reversible, mainly allosteric) and chronic (slow and permanent, mainly transcriptional) control mechanisms. Each substrate has its own regulatory path too. For example, as shown in Figure ↑, Glycerol is not subject to PEPCK or PC-dependent regulation and only Alanine is subject to regulation at the ALT step. All gluconeogenic substrates are sensitive to the activities of FBPase1 and G6Pase.
Gluconeogenesis is regulated both directly and indirectly. Gluconeogenesis requires a supply of its substrates (glycerol, lactate and alanine). Therefore the transport of these molecules from other tissues to the liver is one major regulatory step. As an example, during prolonged fasting, proteins are catabolized and amino acids like Alanine are released. The increased availability of these amino acids results in more glucose production, while also preventing glycolysis (at the PK step) and tipping the ALT equilibrium towards making pyruvate. Another example of indirect regulation is when lipolysis is activated after Cortisol or Adrenaline stimulation. This provides substrates (glycerol), energy (from fatty acid oxidation) and acetyl-CoA ato activate Pyruvate Carboxylase. Gluconeogenesis can also be indirectly inhibited. One example is that insulin suppresses lipolysis. This reduces glycerol and fatty acid delivery to the liver and slows gluconeogenesis (on top of the direct effects of insulin).
Acute Regulation of Gluconeogenesis
As we discussed in the TCA cycle lecture, Pyruvate Carboxylase (PC) is an important anaplerotic enzyme. It is stimulated by Acetyl-CoA levels, to generate OAA from Pyruvate. In terms of gluconeogenesis, a key role of fatty acid-derived Acetyl-CoA is promoting glucose production by activating PC (Perry et al. 2015). While fatty acids cannot directly be converted into glucose, this is one mechanism by which they induce gluconeogenesis. This has important consequences for understanding the relationships between the regulation of lipolysis on glucose production.
The second major site of acute control is at the FBPase1 step. Similar to PFK1, FBP1 is regulated by AMP, and F26bP though in this case the regulation is in the opposite direction (see Table ↑). The levels of F26bP are controlled by the activities of PFK2As we discussed in detail in the glycolysis lecture and FBPase2. In fact, these two activities are the same polypeptide, which comprises a bifunctional enzyme. FBPase2 will remove the phosphate from F26bP, depleting that important allosteric activator of PFK1. F26bP is a potent inhibitor of FBPase1, so its removal activates gluconeogenesis while stopping glycolysis. The same PKA-dependent phosphorylation that that reduced PFK2 activity activates FBPase2 activity resulting in less F26bP and F16bP will be directed towards glucose. In addition to the effects of F26bP, FBPase1 is inhibited by AMP. Since gluconeogenesis is so energy consuming, this regulatory step ensures that ATP is sufficient for gluconeogneesis to occur. A comparison of the regulation of FBPase1 and PFK1 is shown in Table ↑ and more details about FBPase regulation can be found in this review: Okar et al. (2001).
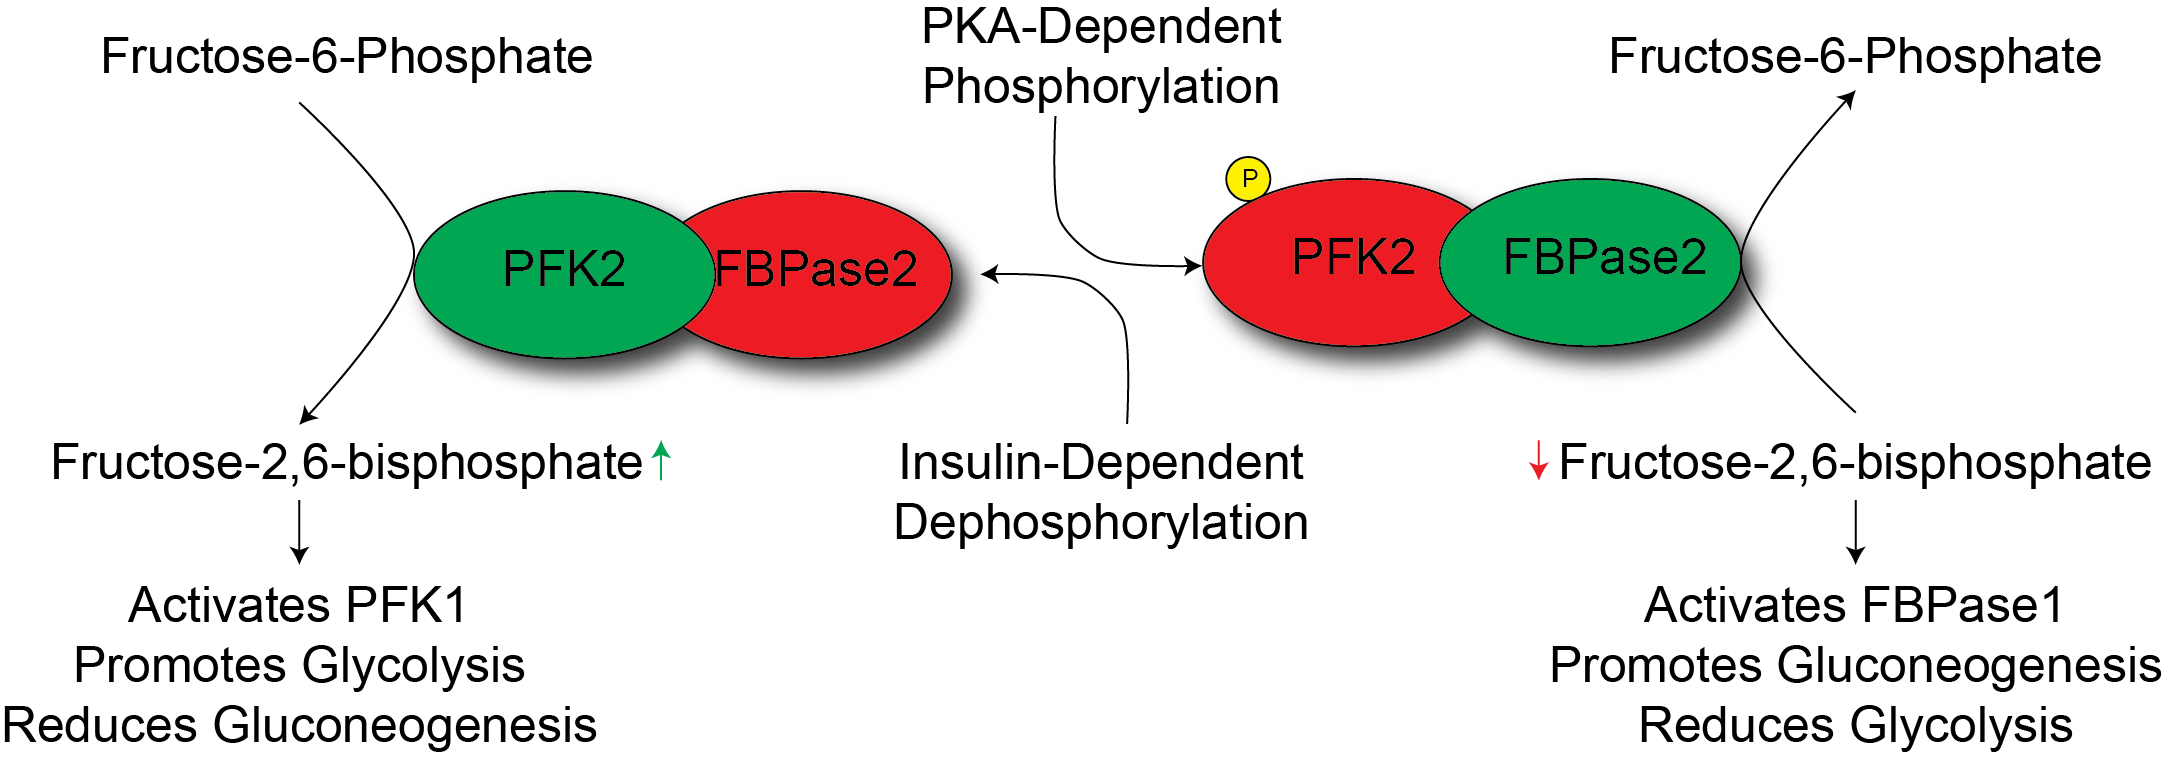
PKA, activated by Glucagon or Epinephrine promotes gluconeogenesis in the liver. By inactivating PFK2 and activating FBPase2, PKA drives glucose production from precursor molecules in the liver. This, along with promoting the breakdown of glycogen provides tissues with glucose in times of need. Gluconeogenesis is slower and more costly than glycogenolysis, but is able to use a wider variety of sources to make glucose.
| Regulator | PFK1 | FBPase1 |
|---|---|---|
| F26bP | Activates | Inactivates |
| AMP | Activates | Inactivates |
| ATP | Inactivates | - |
| Citrate | Inactivates | - |
| PKA | Inactivates | Activates |
Transcriptional Regulation of Gluconeogenesis
In contrast to PKA’s effects activating gluconeogenesis, insulin potently suppresses the production of glucose. Since insulin is elevated in response to elevations in glucose, this suppression is a major part by which insulin reduces blood glucoseThe others being stimulation of glucose uptake and glycogenesis. One mechanism by which this is thought to occur is through transcriptional regulation, largely through the transcription factor FOXO. Insulin promotes the Akt-dependent phosphorylation of FOXO, which removes it from the nucleus, rendering it inactive. Several key gluconeogenic genes are FOXO targets including PEPCK and G6Pase. This means that when insulin inhibits FOXO function, the transcription of those genes is markedly reduced (see Figure ↑). More information about the role of FOXO can be found in Barthel et al. (2005).

Cortisol is another gluconeogenic hormone. By binding to its nuclear hormone receptor, glucocorticoids such as Cortisol can promote the transcription of Pyruvate Carboxylase, PEPCK and G6Pase. You can think of this as the opposite of the effects of insulin. By synthesizing more of these rate limiting enzymes, Cortisol can promote glucose production and make glucose available to the rest of the body during times of stress. Notably, glucocorticoid-induced hyperglycemia is a result of Cushing’s diseaseOverproduction of cortisol by the adrenal gland, often associated with pituitary or adrenal tumors. or prescription glucocorticoids such as predinosone or cortisone. In times of stress, one the main functions of Cortisol is to ensure proper supply of glucose to the brain.
Consequences of Unrestrained Gluconeogenesis
While gluconeogenesis is essential to maintaining blood glucose levels in times of glucose deprivation, activation of gluconeogenesis is a hallmark of both Type 1 and Type 2 diabetes. Insulin’s ability to suppress gluconeogenesis is either absent (in type 1) or impaired (in type 2 diabetes). Diabetics therefore tend to have over-active gluconeogenesis, which results in elevated blood glucose. Insulin resistance promotes both direct (hepatic) and indirect activation of gluconeogenesis, and the rates of gluconeogenesis in diabetics are nearly double than in controls (Magnusson et al. 1992). Even in the absence of dietary glucose, elevated glucose means that hyperglycemia may be present due to increased gluconeogenesis. Gluconeogenesis is therefore an active target for controlling blood glucose in diabetes, which now affects more than 29 million Americans, with another 86 million considered at risk(Centers for Disease Control and Prevention 2016).
Reflection Questions
A patient with type 2 diabetes has elevated fasting blood glucose despite not having eaten overnight. Trace the mechanisms responsible, explaining the roles of both the liver and adipose tissue. Include the direct effects of impaired insulin signaling on hepatic FOXO activity and gluconeogenic gene expression, and the indirect effects through dysregulated lipolysis in adipose tissue and substrate delivery to the liver.
Cortisol promotes transcription of PEPCK and G6Pase, driving gluconeogenesis. Cortisol is also orexigenic — it increases appetite and food intake. Evaluate how these two effects acting together could create a vicious cycle driving weight gain and worsening hyperglycemia in a patient with Cushing’s disease, and predict how each arm of this cycle would reinforce the other.
During a prolonged five-day fast, a healthy person maintains near-normal blood glucose. Apply your knowledge of gluconeogenic substrates and their regulation to predict the sequence in which glycogen, lactate, glycerol, and alanine each become progressively more important, explaining the metabolic trade-offs — including the costs to muscle mass and TCA cycle efficiency — as the fast extends.
Carbohydrate Unit Integration Questions
A healthy person eats a meal of white rice, steamed broccoli, and a glass of milk. Trace the complete fate of the carbohydrates from digestion through metabolic disposal. Your answer should address: glycosidic bond specificity of digestive enzymes, transporter selection at the enterocyte, the incretin effect and insulin secretion, tissue-specific glycogen responses in liver vs. muscle, and the fate of the indigestible fiber from broccoli in the large intestine.
A patient with poorly controlled type 2 diabetes presents with fasting hyperglycemia, elevated triglycerides, and fatigue. Using your knowledge of the entire carbohydrate unit, explain how insulin resistance simultaneously impairs GLUT4-mediated glucose uptake, fails to suppress hepatic gluconeogenesis via FOXO, disrupts intestinal GLUT2 feedback, and promotes lipolysis in adipose — and how the resulting excess Acetyl-CoA explains the hypertriglyceridemia.
During a marathon, an athlete hits the wall when muscle glycogen is severely depleted. Explain why glycogen depletion impairs performance, what gluconeogenic substrates the liver shifts to (including the Cori and Cahill cycles), how PDH regulation changes as lactate accumulates, and why consuming a sports drink containing both glucose and fructose could delay depletion more effectively than glucose alone.
A patient is prescribed prednisone — a synthetic glucocorticoid — for three months and develops new-onset hyperglycemia. Connect mechanisms from across the carbohydrate unit to explain this outcome, including glucocorticoid effects on gluconeogenic gene transcription, impaired insulin signaling in muscle and adipose, glycogen metabolism, and the orexigenic effect increasing dietary carbohydrate intake.